


2018 vs 2017 Housing Market Data
Pixel Staff
What's important about housing data?
At Pixel Properties, we are always looking at data. We watch for blips and subtle movements in the numbers that point to future trends that can help our clients gain a competitive advantage in the market place as we are helping them to sell or buy a home. We love the data and nerd out on the numbers, but the economic data alone is only a small part of the information that informs us as agents. Here is our review of a few major data points from 2018 compared to 2017 that might help you make the best decisions you can with your home. To see how this data starts to form part of your future story, contact one of our agents today.
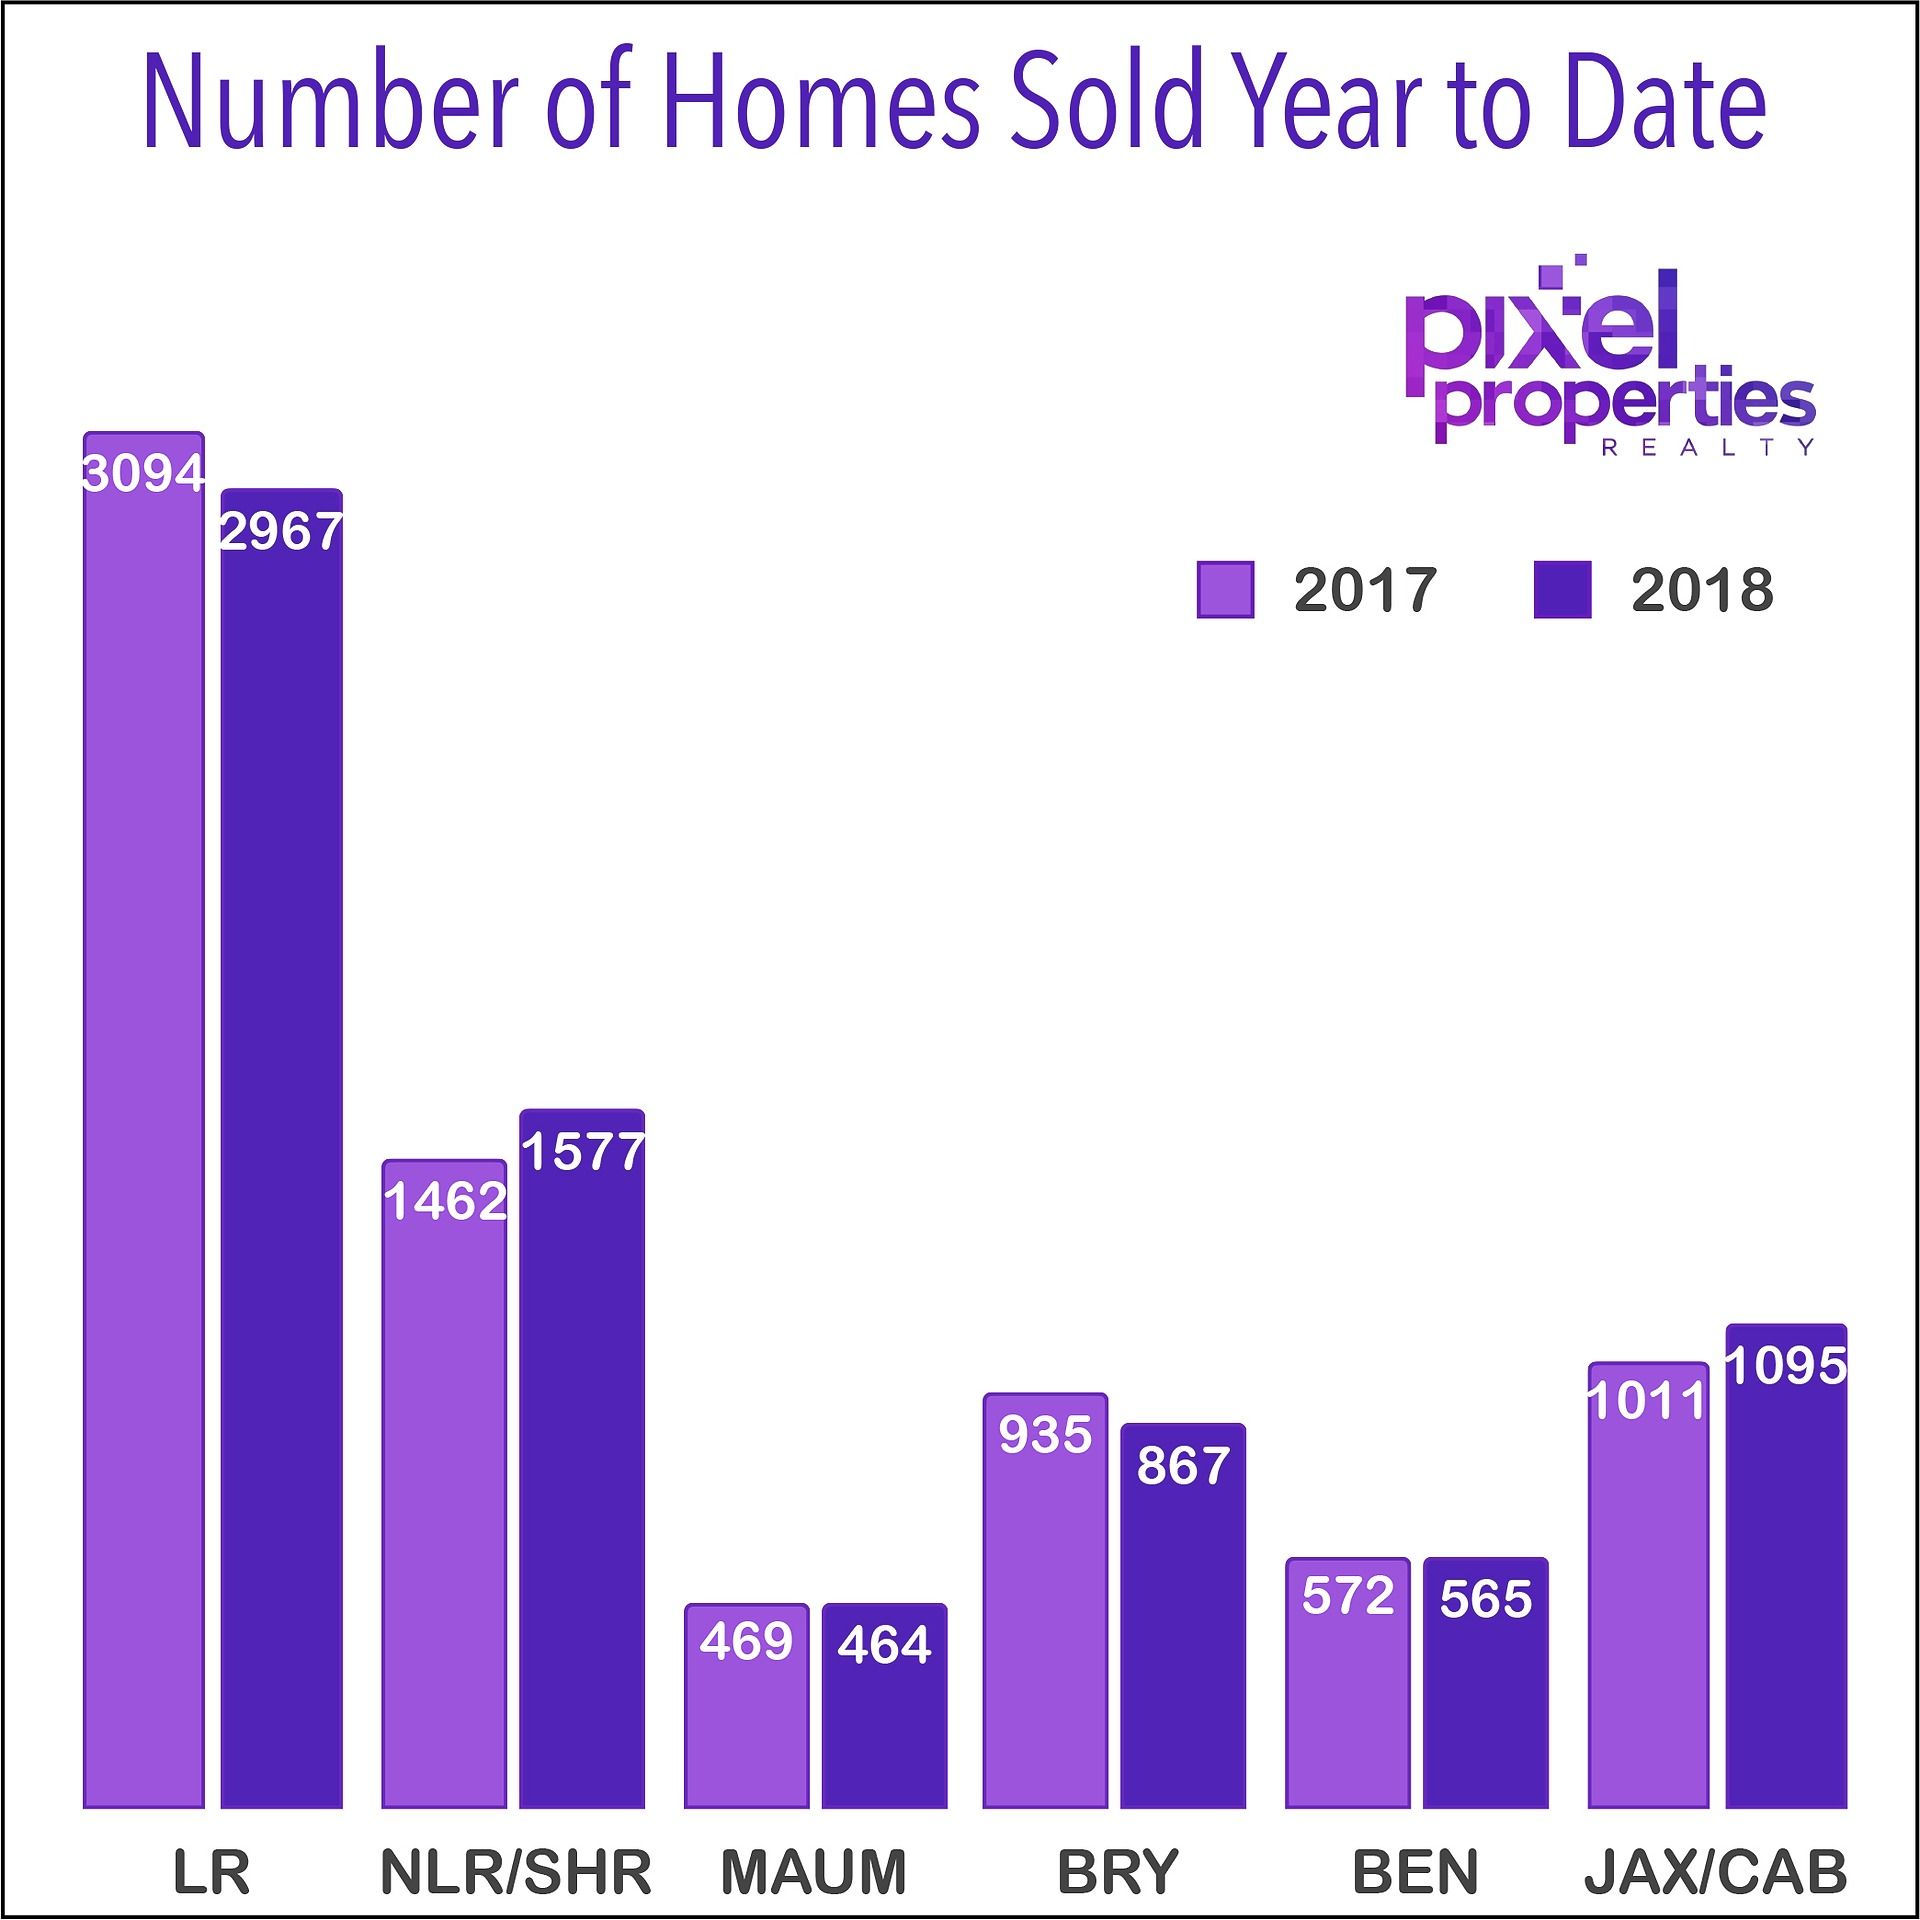
Number of Homes Sold
For most of the market, the number of homes sold in 2018 compared to 2017 was relatively flat. Only two areas that we tracked last year sold MORE homes; North Little Rock/Sherwood and Jacksonville/Cabot. And there were two markets that sold LESS: Little Rock & Bryant. Both Maumelle and Benton were relatively flat. Home sales were also down nation wide. Most economist believe it was likely due to a lack of supply.
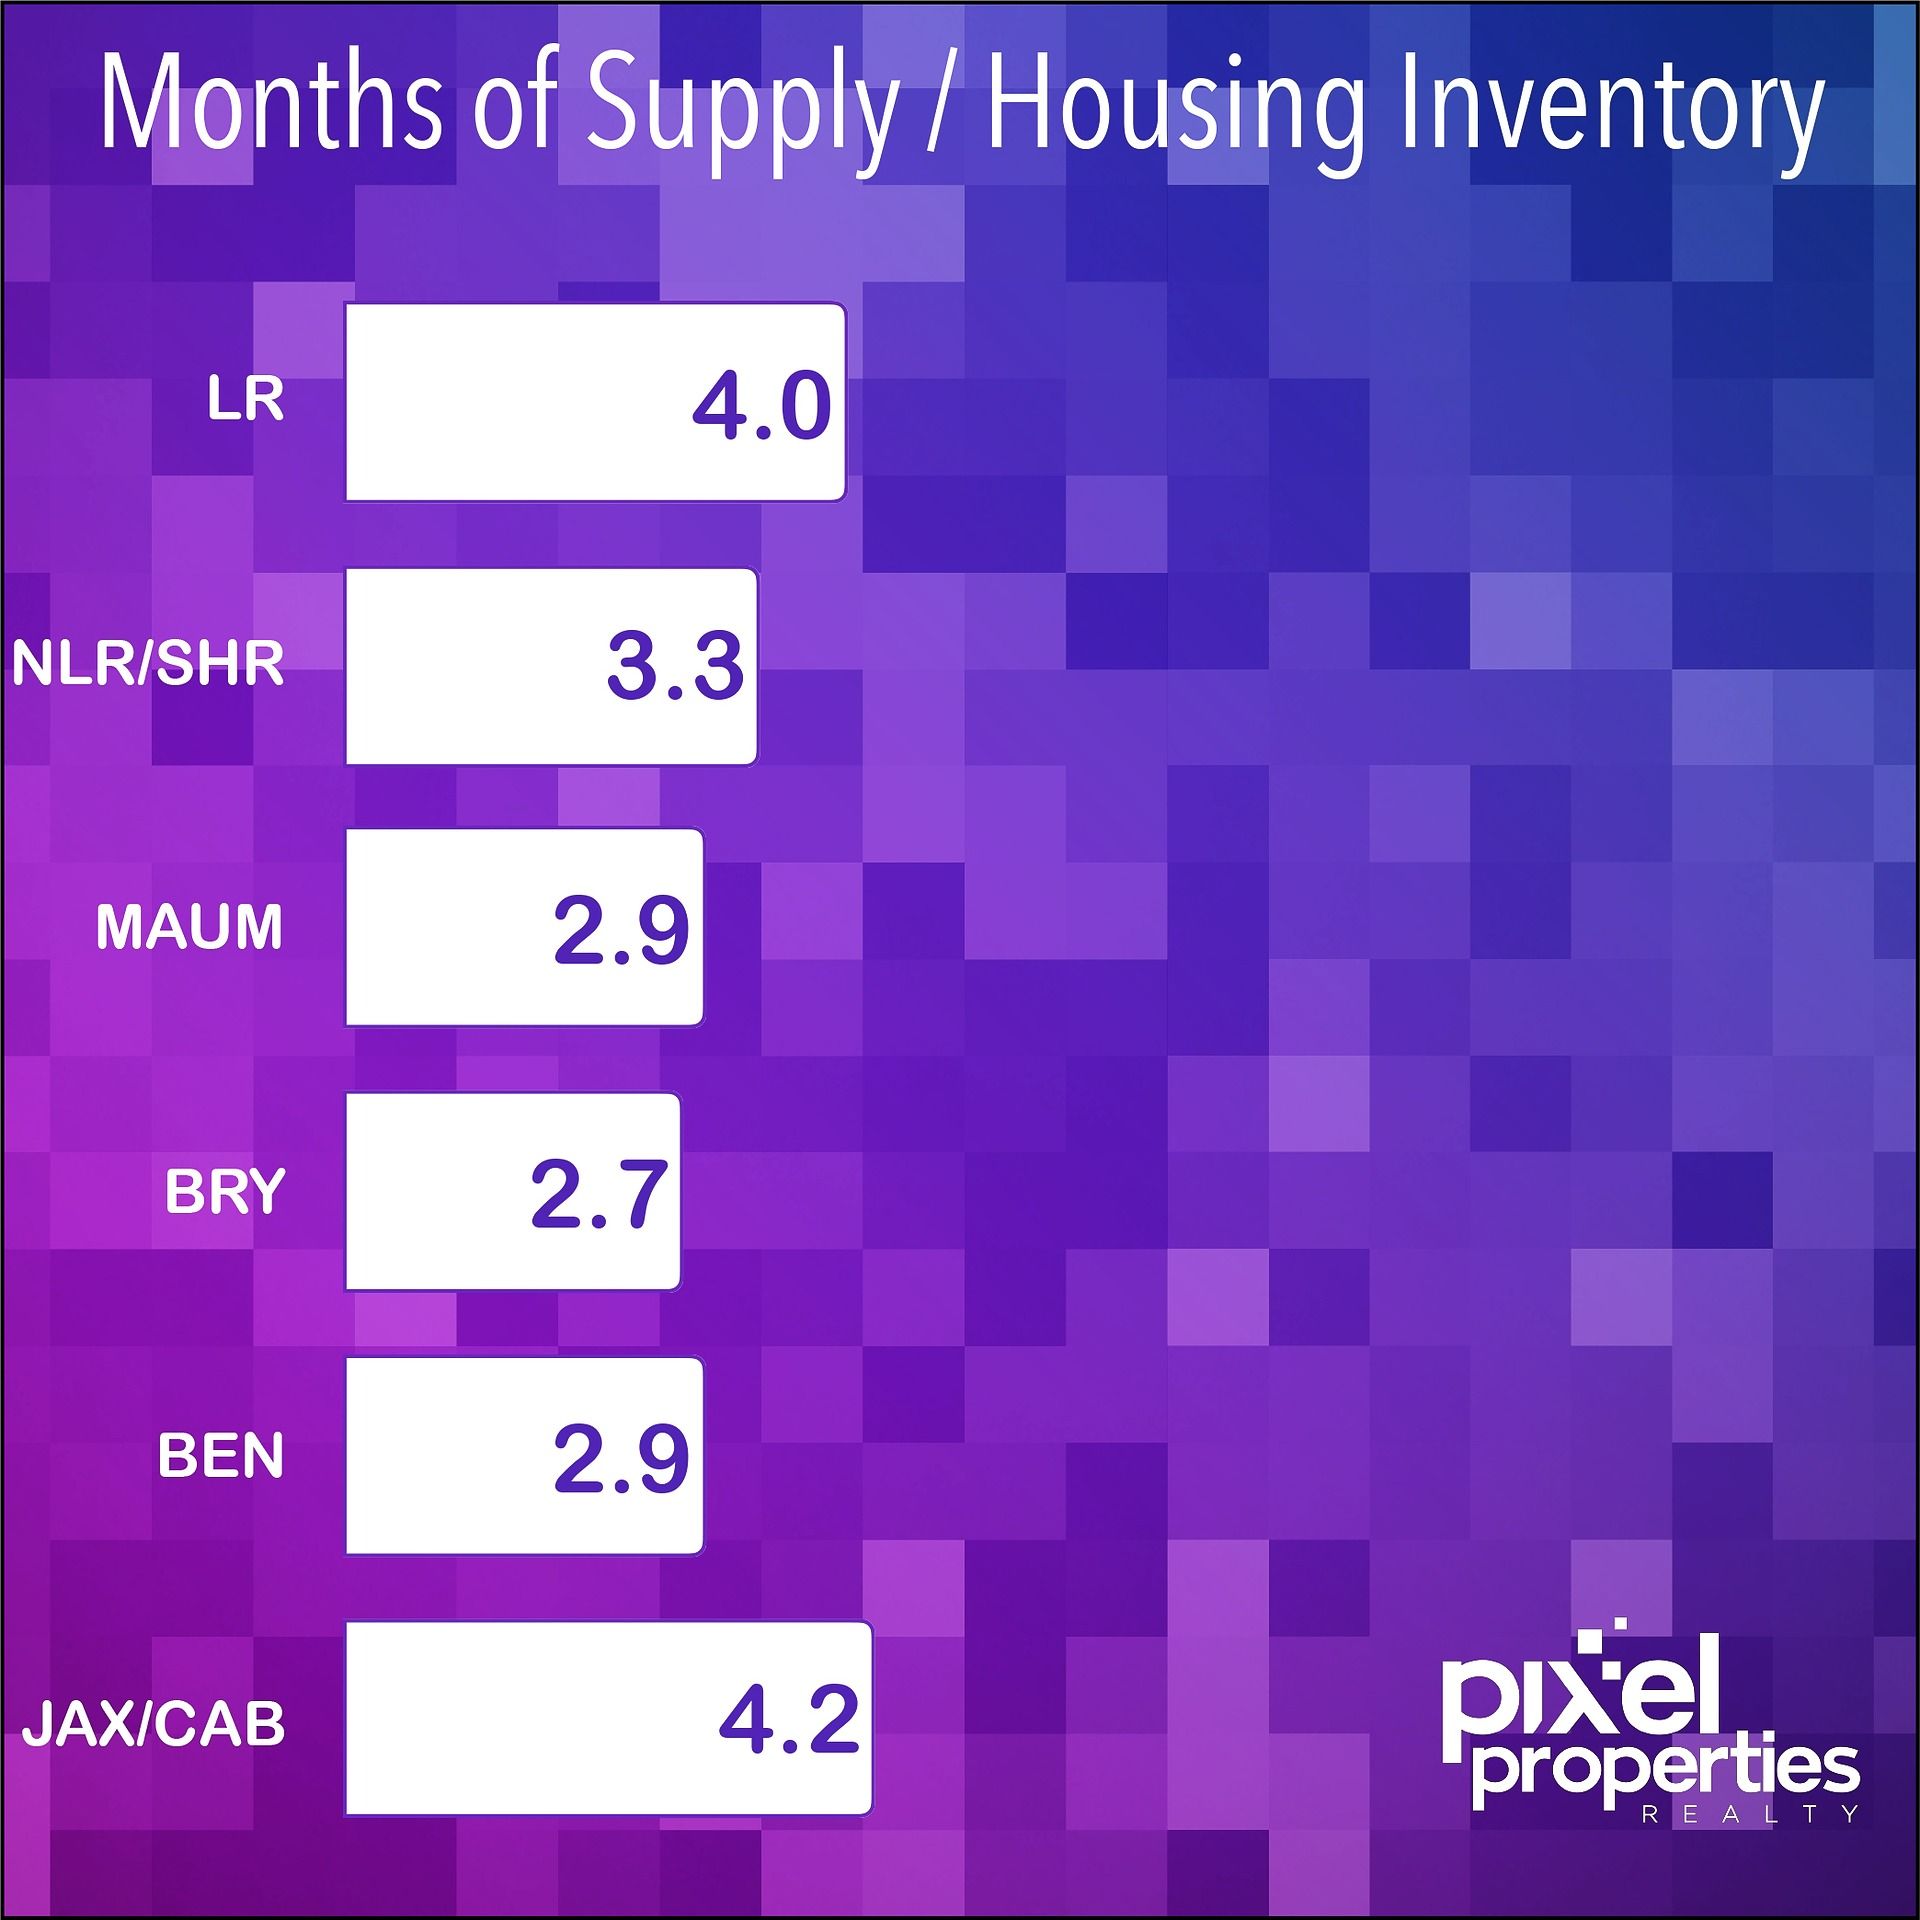
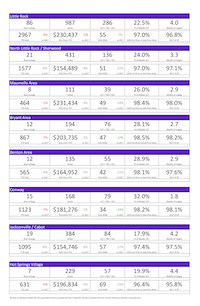
Months of Supply / Housing Inventory
Housing inventory is the measure of homes that sale in the last 12 months compared to the current inventory listed and active on the market. In our market, from 0 to 3 months of supply would be considered more of a sellers market. From 4 to 6 months would be a neutral market favoring neither the buyers nor sellers and anything over 7 months of supply would be considered a buyers market and a market that is highly competitive for sellers. Most of our area is averaging from nearly 3 months of supply to about 4 months of supply. So while our market is still favoring sellers, it also appears to be leaning towards a neutral market, though some of the inventory may be seasonally low at the start of 2019.
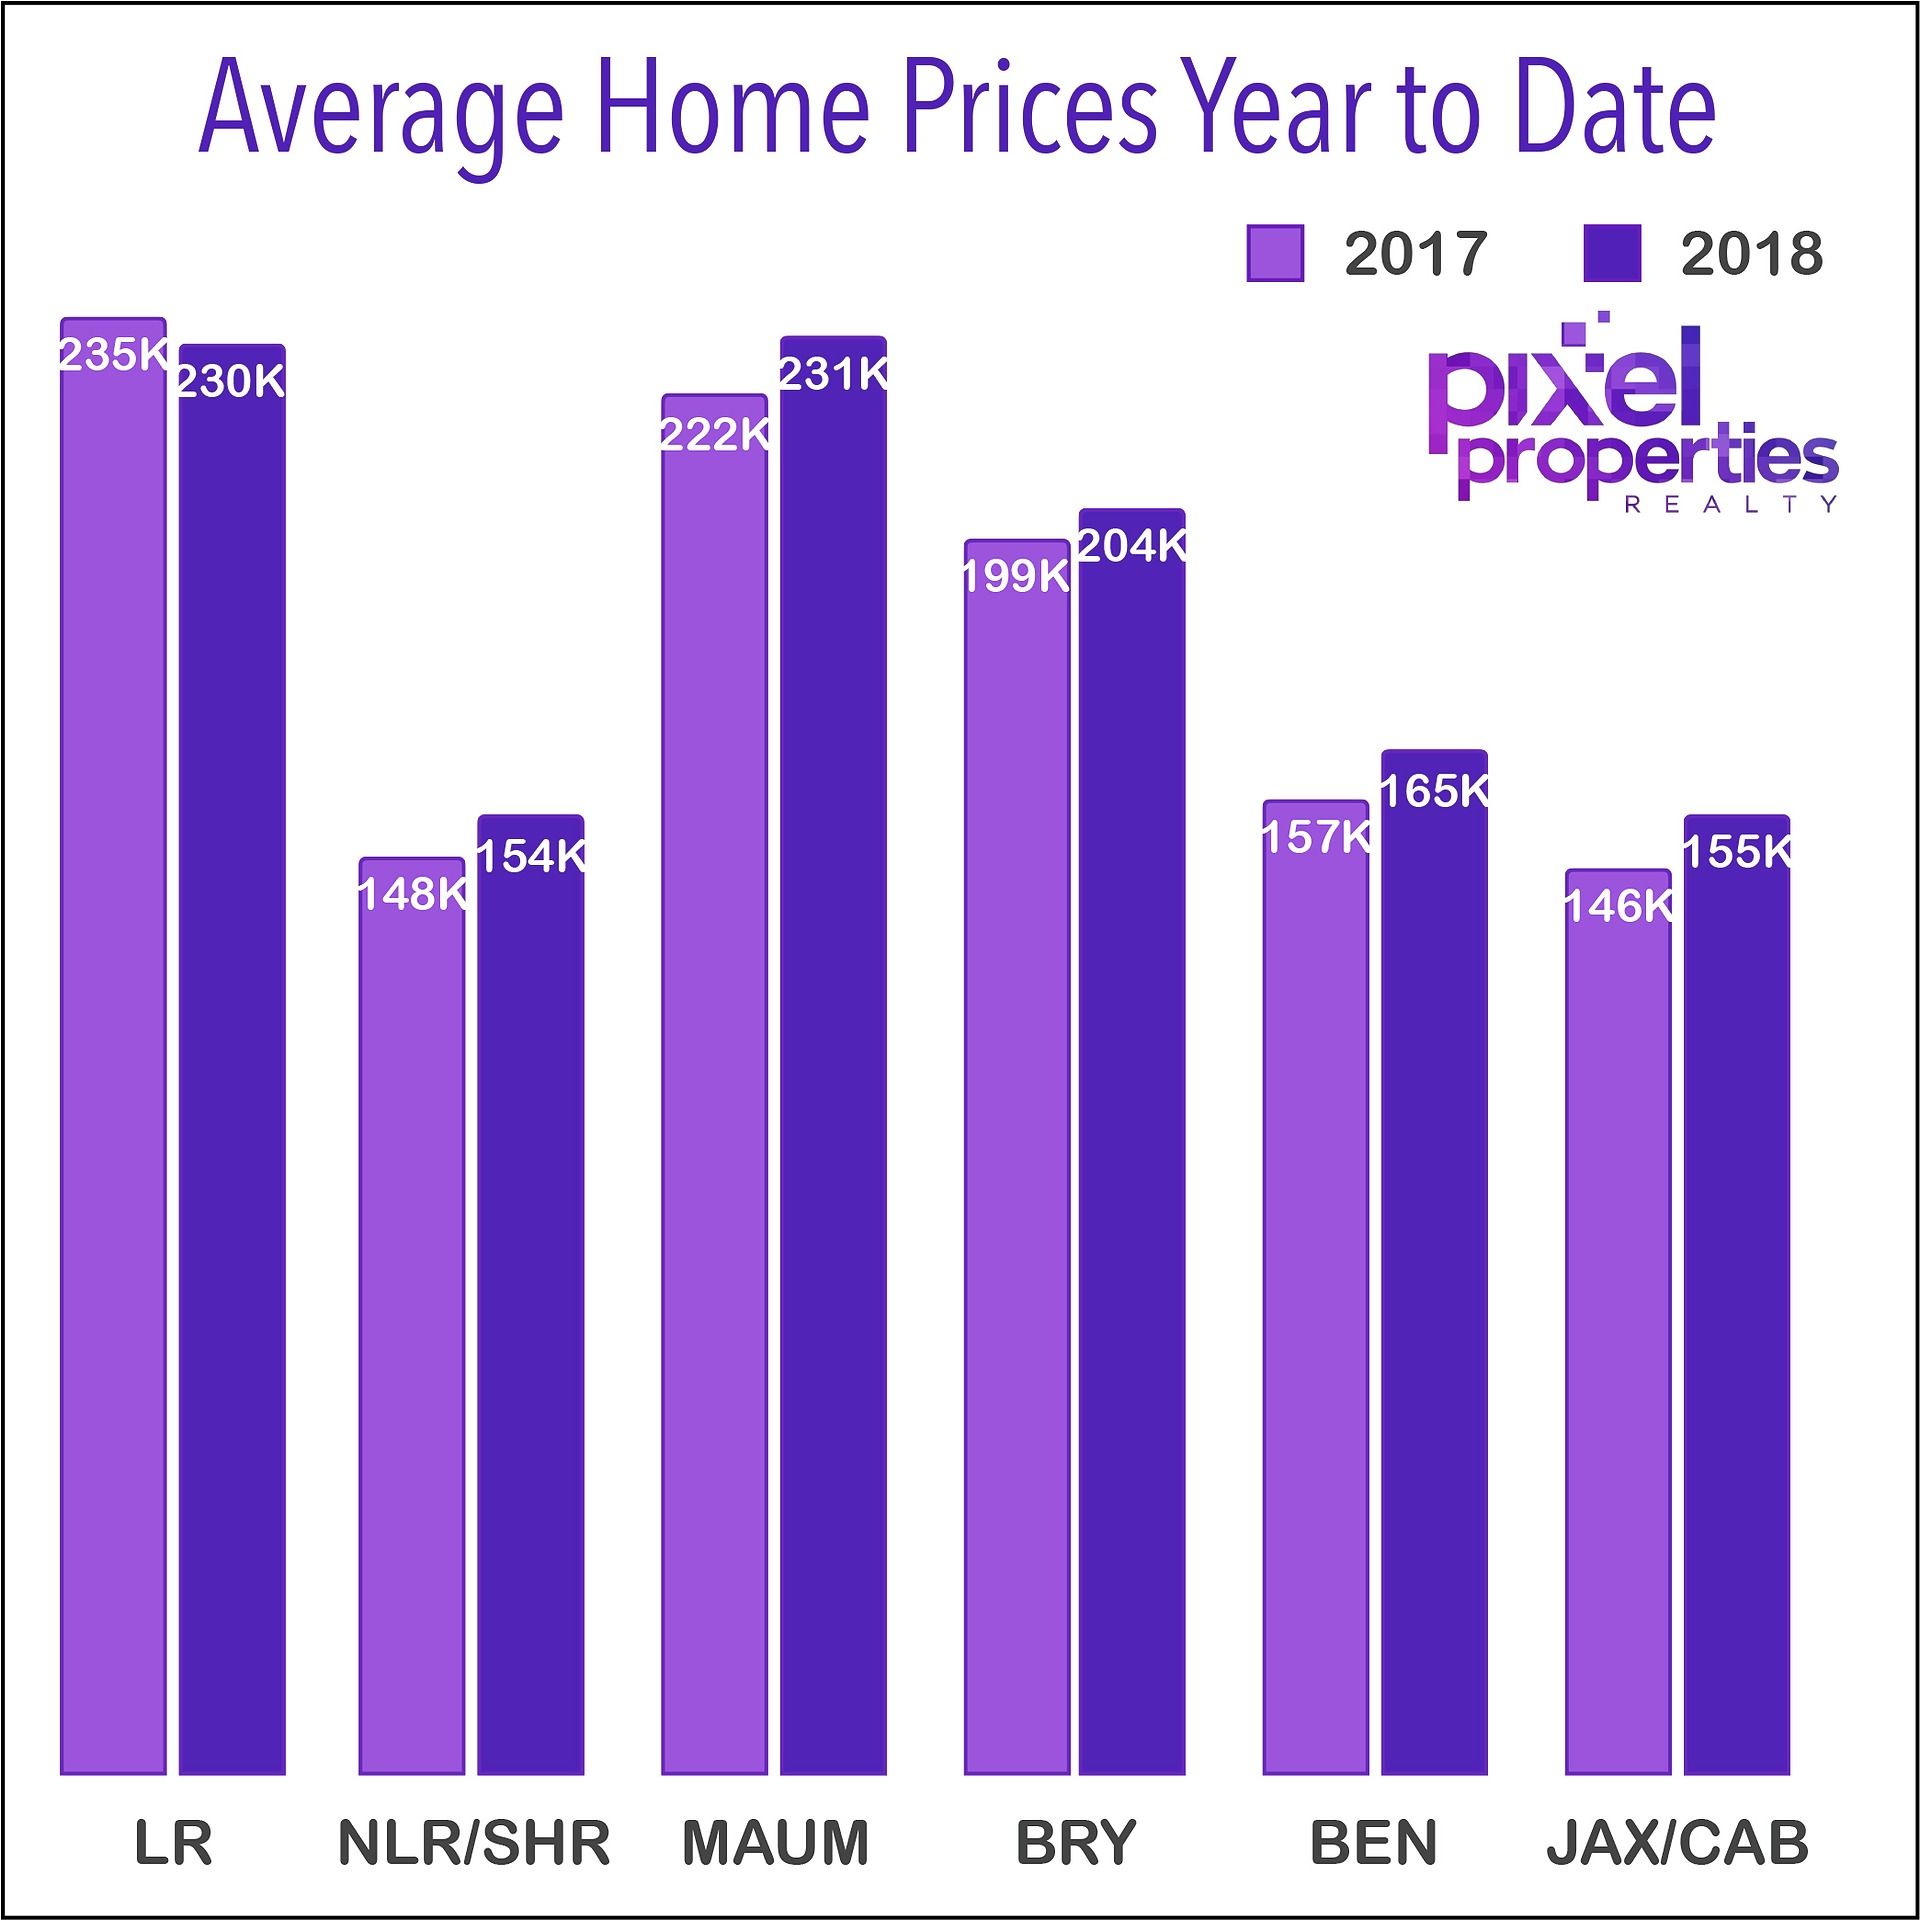
Home Prices
As we check the average home prices, we see that most of the market increased in the average home price from 2% to 6% being the highest with the lowest mover being Little Rock which actually decreased in price by 2% compared to 2017.
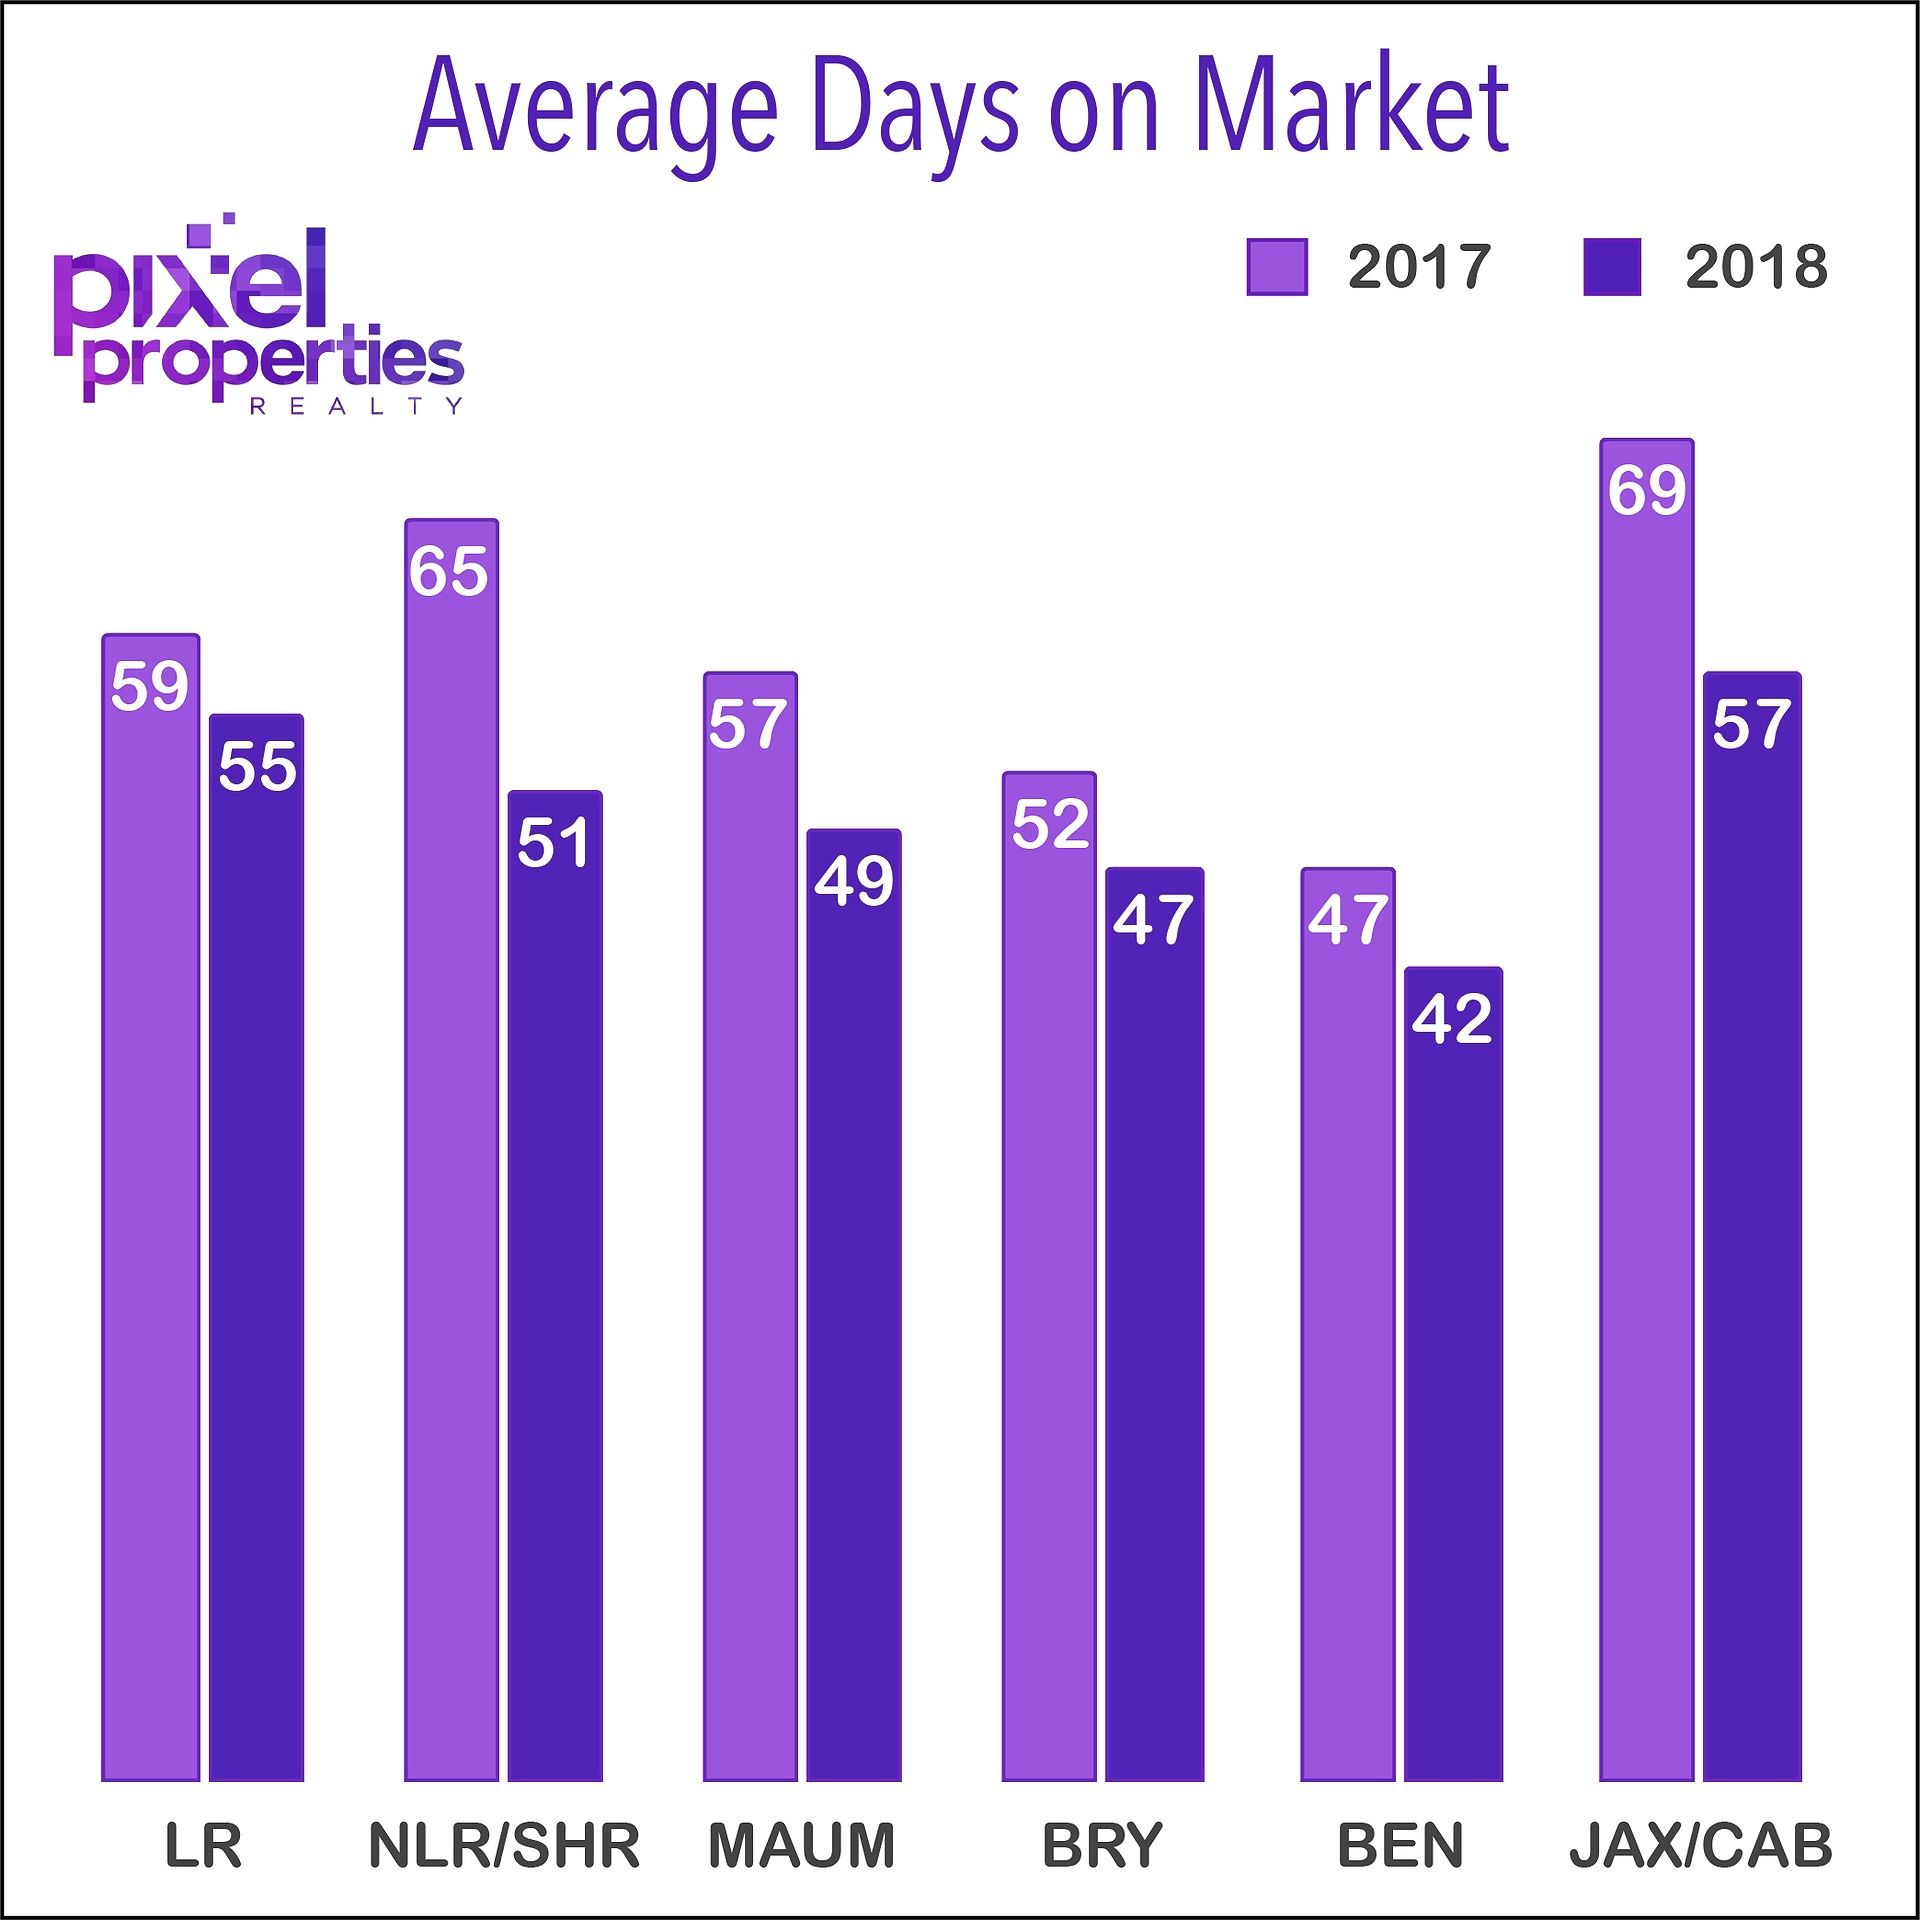
Days On Market
Days on Market is a measure of how fast homes are selling. In 2018 the days on market averages are far lower than 2017 which tells us that when people found the home they were looking for, they moved faster to purchase that home. The market average is still hovering around 60 days on market, however, top agents are still able to sell in half the time. The Average Days on Market for Pixel Properties is about 30 days.
Download the Full Report
Sign up for our email newsletter & download a spreadsheet with ALL the data including list price to sale price ratio comparisons, price change data, and more!!
We respect your inbox. We only send interesting and relevant emails.